Previous
Previous
A Pleasant Conversation
Next
Next
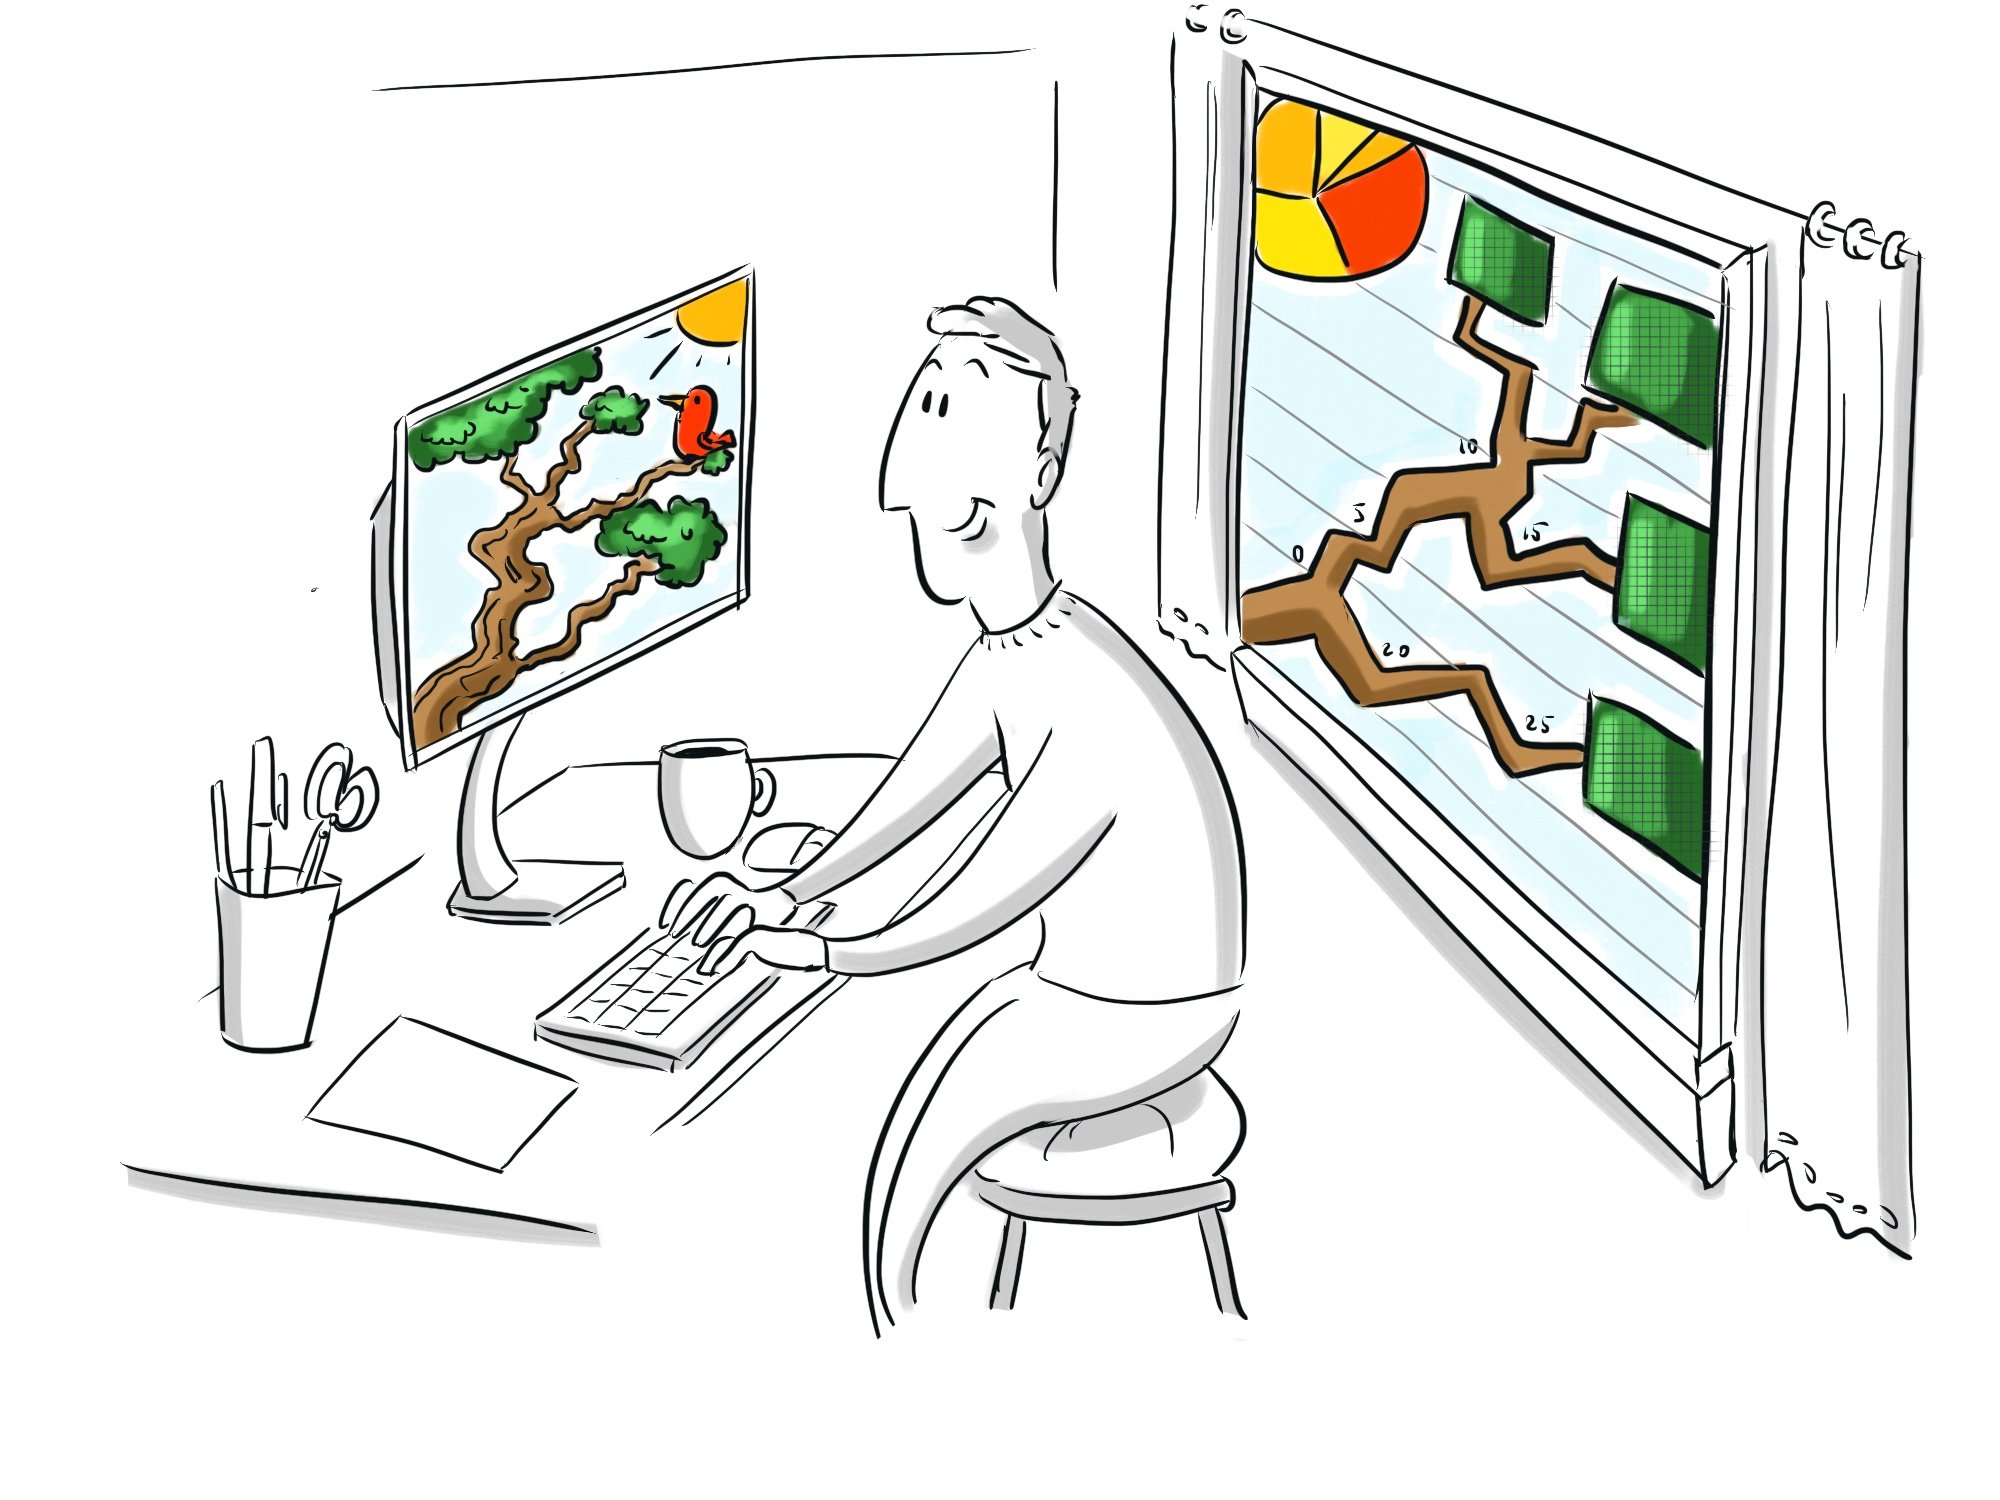
Throwing up some Pie Charts and Mind Maps can be useful, but if you add some colour and flare it can captivate an audience much more easily.

It’s like the scene in Jurassic Park where the T-Rex only spots you when you move. Humans are similar, we need Visuals that pop out!